Finding Straight Lines with the Hough Tranform

Java Code
HoughTransform.java
HoughLine.java
If you choose to represent a line with the following equation:
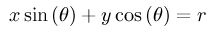
then you can represent any line so long as you know the values theta and r. The Hough transform is used to discover the values of these parameters, given some data about known x,y points along the line.
Assuming you have such an x,y point, you can calculate all values of r by going through all possible values of theta. If you plot these values on a graph for every value of theta you get a sinusoidal curve.
In practice, the x,y coordinates are identified after performing some sort of edge detection, for instance using Canny's edge detector. The Hough tranform works by looking at a series of such x,y coordinates and transforming each one into an r, theta curve. When you plot all these curves together on the same graph, the curves for a number of x,y points on one line will all cross at a single point. This point represents the common values of r and theta, and once we have these we can complete the equation for the whole line.
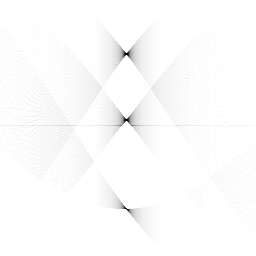
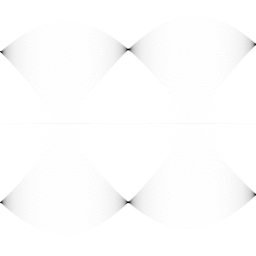
These points are identified by creating a two-dimensional "accumulator" array. The accumulator array is plotted rectangularly with theta on one axis and r on the other. For each value of theta the value of r is calculated, then the value in the accumulator array at [theta][r] is incremented by one.
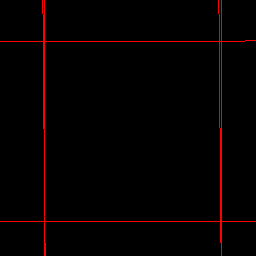
Once all the points have been added the array should be full of values (see images of the accumulator array below). The algorithm then searches for peaks in the array. The higher the peak the more x,y points crossed along that curve, so high peaks give good indications of a line. In the code, basic thresholding is used to identify the peaks, and a local search is used to try and ensure that only one line is found per peak.
Choosing Parameters
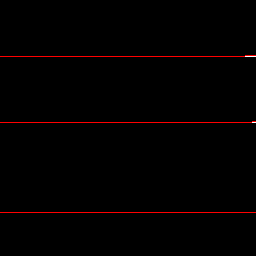
We found that a 180 was a good number of theta steps. Interestingly, increasing the number of steps doesn't seem to improve the accuracy as it generates a larger, more blurred accumulator array, so you may get multiple results for one line. We used a local saerch neighbourhood size of 4, which equates to a 9 × 9 neighbourhood checking for other local maxima, which reduces the number of superflouous lines quite nicely. A thereshold of 30 was used which states that a point in the array must have had 30 "hits" before it is considered a line. The results below were produced using these parameters.
Some Visual Results
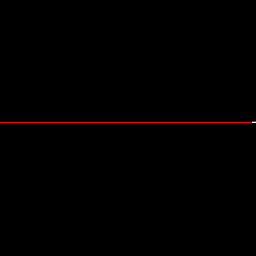
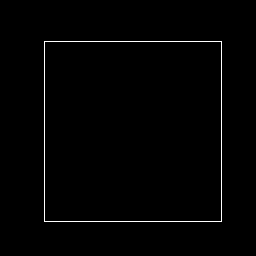
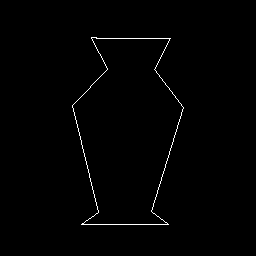
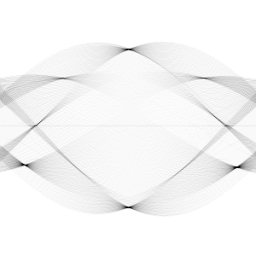
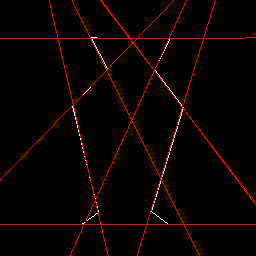
The following are some examples of the output of the hough transform on test images. They were all generated using the Java code listed above.
| edge-detected image | image of the Hough accumulator array | lines discovered (threshold 30) |
|---|---|---|
 |
 |
 |
 |
 |
 |
 |
 |
 |
 |
 |
 |
Note
This program is based on an original tutorial and Java code from http://homepages.inf.ed.ac.uk/rbf/HIPR2/hough.htm.