JavaPlot
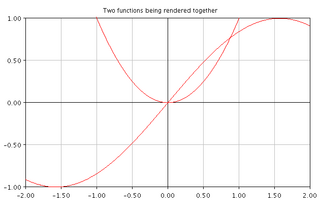
This Java program allows you to plot mathematical functions or basic charts. You supply a formula and the program will draw it for you on a line graph.
The GraphPanel object allows you to add these graphs into your Java Swing applicationa easily. The InteractiveGraphPanel is an extention to GraphPanel, which allows the user to move around the graph by dragging the mouse, and zoom in and out with the scroll wheel.
If you need more serious graphing software for Java, you may want to look at jfreechart.
Features:- Plot continuous mathematical functions
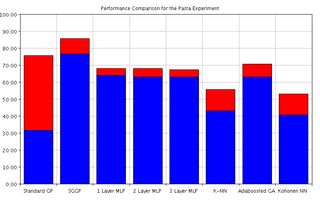
- Plot discrete functions using bar charts or candlestick plots
- Add these charts to your Swing applications easily
- Create interactive charts using the InteractiveGraphPanel object
- Save charts to popular image formats easily
- Demo Swing GUI
- Control the settings and appearance of your graph via the PlotSettings object
More Information
Have a look at the following code files to see how to use it: Demo.java shows how to create a simple graph. GraphApplication shows how it can be implemented into a Java SWING application. The classes SineWave.java and Gaussian.java show Java implementations of sine and gaussian probability functions respectively.
A simple way to visualise a mathematical function:
- Write a class extending ContinuousFunctionPlotter and implementing the getY() method
- Use Demo.java to display the results of your function
Graph rendering code is in Graph.java; do have a look.
Online Demo
Download
The source code, along with compiled classes and JAR file are available here: